
Academic Maps and Infographics
- by Bek Cruddace
- in Educational Publishing
- posted September 12, 2025
Last year I was contacted by the United Nations University to work with them to update and re-design a series of academic maps and infographics for an upcoming book about climate change.
This commission was a little bit different than my usual hand illustrated work but something I felt comfortable doing because of past experience with academic maps and infographics work.
It was a pleasure not only to work with the UNU, but also to have the opportunity to work on something so interesting and impactful.
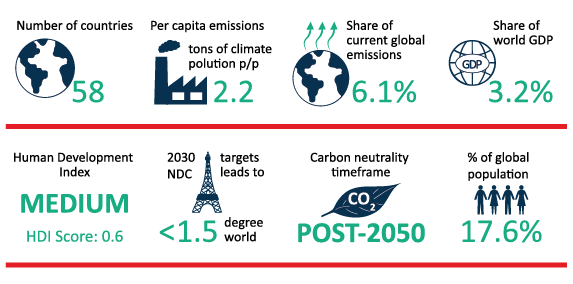
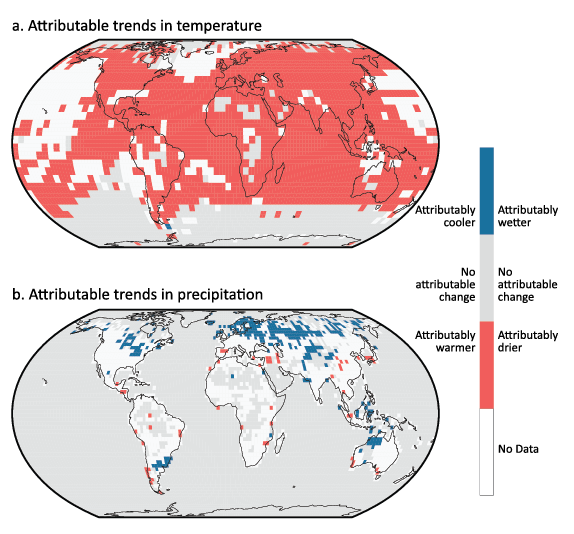
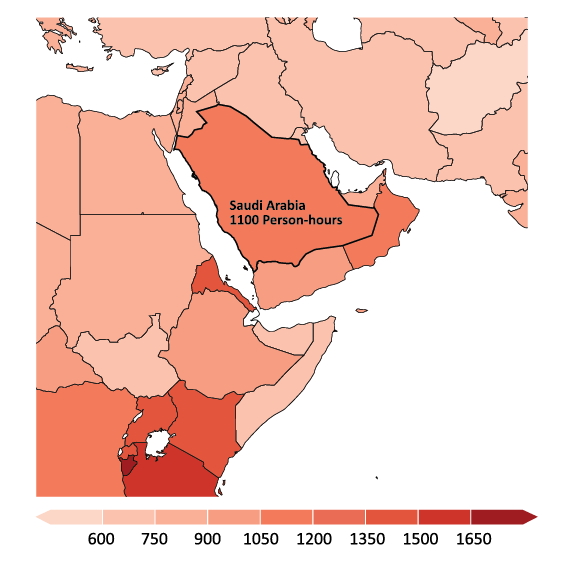
Overall, I produced 32 maps, infographic and charts depicting the effects of climate change on some of the most geographically vulnerable regions of the world.
The book, From Crisis to Action: Climate Change Through the Eyes of the Most Vulnerable was published in early September 2025 and is now available through Amazon and from the United Nations University website.